The Burning Questions That Instagram Insights Can Answer
By: Danielle Brigida, U.S. Fish and Wildlife Service
January 5, 2018
In the early days of Instagram, you had to do a lot of guesswork on how people interacted with your profile, aside from likes and comments.
But the platform’s native analytics have steadily improved over time to provide more of an understanding of what your audience wants. Here are a few ways you can use Instagram’s provided insights to understand your audience better and see what content keeps them engaged.
Accessing Insights
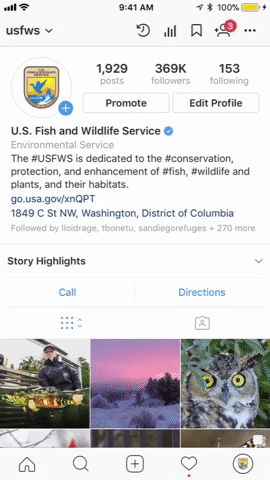
When on the profile view of the Instagram business profile, notice the navigation at the top. Select the chart icon and you’ll enter Instagram Insights.
 The wild animals that populate our Instagram feed on @USFWS may not seem that nuanced at first glance. But by diving into the analytics, we can collect and discover new ways to understand the content that resonates. We make sure to share lots of wild animals but we’ve also used stories, and how people save our content or comment, to make the most of the platform.
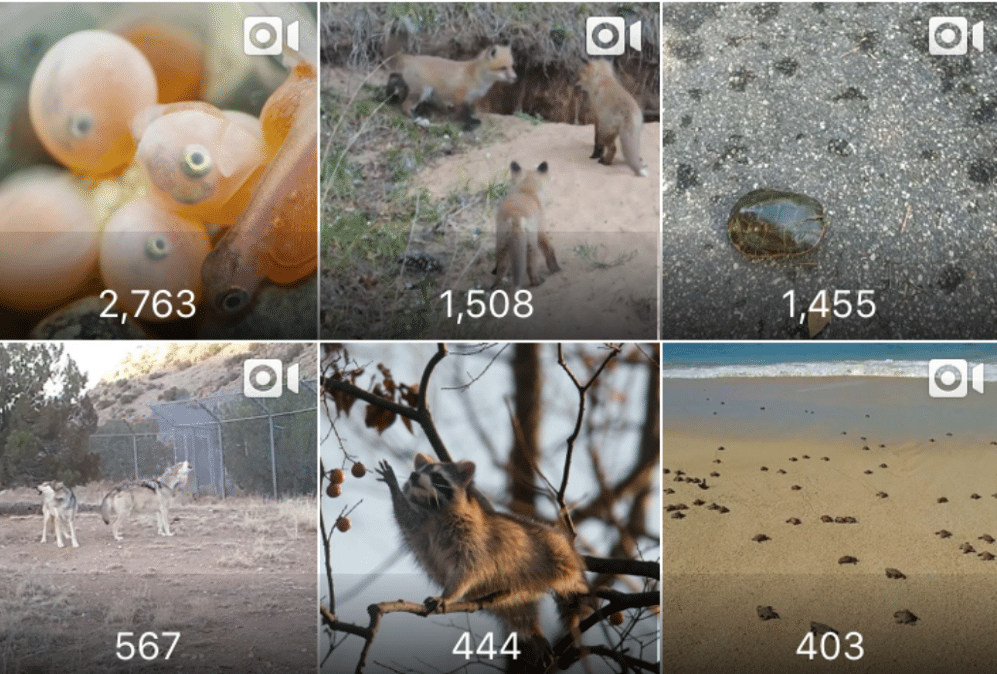
Breakdown of the Main Insights Page
Overview of the past seven days: This defaults to show you impressions, or all the people who have had the chance to see your content for the past seven days. If you check this regularly and document it, you can figure out which days are consistently popular.
By swiping to the right, you can also get a breakdown of reach, profile views, website clicks and call clicks, and get direction clicks for the week as well.
Followers: This gives you an overview of your audience breakdown with age range and the top cities of people who follow you.
By clicking on “see more,” you can access your follower growth over the past seven days as well as an audience age comparison. These stats are very similar to what Facebook provides.
All of this is pretty basic but it’s not entirely intuitive: You have to search for it. The fun comes from understanding your posts and stories.
For More on Posts and Stories, Click “See More”
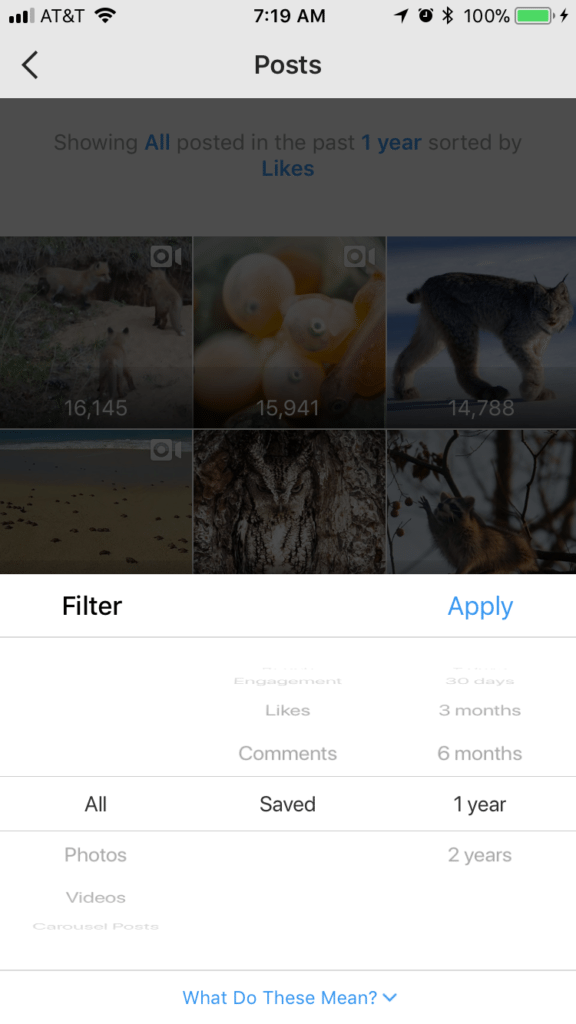
When you select posts, the default is to show you “all,” which means video, photo or galleries for the past year, sorted by impressions. But all of those stats are things you can select and change out for more information.
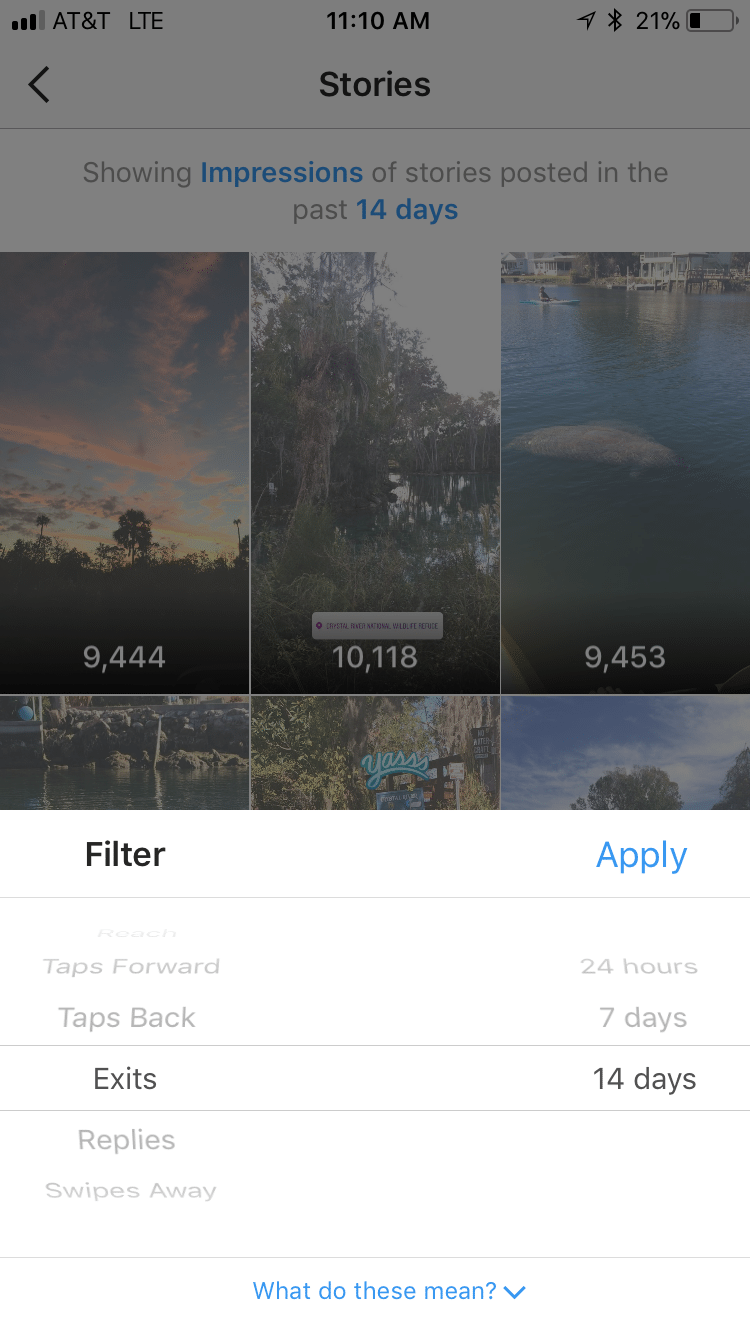
Insights From Stories
For about 14 days after you post a story, you can see several helpful data points. The default again points you to impressions (which I don’t find as useful) but if you click on impressions, you can switch it out for several additional metrics, including: 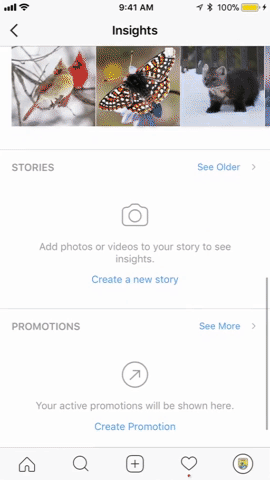
- Reach
- Taps Forward
- Taps Back
- Exits
- Replies
- Swipes Away
I’m particularly interested in exits and taps back (and forward). Depending on what we are asking people to watch or do, this can give me helpful knowledge around what they actually like to see from us.
Taps forward indicate that maybe the video or post didn’t capture their interest (which may be OK if it’s meant as a transition). But exits, swipes away and taps forward tell part of a data story for how users have interacted with our content.
Instagram Insights : The Future and Beyond
For any of these functions to be useful over time, we’ll likely need a longer date range and an export feature. But these initial snapshots of how people are interacting with your content can help when it comes to digging into what is working. Hopefully, Instagram will continue investing in business profile analytics so that we can make educated future decisions.
Is anyone using Instagram promotions? How do they stack up?
Danielle Brigida leads social media at the U.S. Fish and Wildlife Service. An early adopter of social media, Danielle has been recognized as one of the 10 Most Generous Social Media Mavens by Fast Company, one of the 75 Environmentalists to follow by Mashable, and one of 10 People to Follow Who are Saving the World by Mother Nature Network.
Follow Danielle: @starfocus