6 Ways Communicators Can Use Google Analytics’ Intelligence Feature
By: Jerry Ascierto
September 26, 2017
Communications pros recently logging into Google Analytics (GA) may have noticed a new feature in the upper right-hand corner of the interface, simply called Intelligence.
The feature—which was in beta testing this summer and rolled out earlier this month—allows users to ask a question in plain English to get analytics answers to a variety of queries. That’s no small feat given the amount of metrics and dimensions available in GA, a prolific sea of data which can sometimes intimidate communications pros as they set out to build reports.
Intelligence applies the same natural language processing technology available in products like Android and Search, and the company says it will get smarter over time as it learns the types of questions users are interested in most.
For instance, if you want to know where the most new users of a website are coming from, you don’t need to manually search through GA’s nooks and crannies—you can simply ask “What countries are the most new users from?” But you don’t even need to be that precise. You can get the same results by asking “Which locations are new customers coming from?”
The application can also answer questions specific to certain groups of users. For instance, advertisers can swiftly get answers to queries like “Which banner ad content performs the best?” or “Which paid search keywords convert the best?”
Here are six other types of queries provided by Google to illustrate how communications pros can get answers to their GA questions quickly using Intelligence.
You can ask basic questions: How many users did we get yesterday? Where is my traffic coming from?
You can check performance: Which channel converted the best for [Goal X]? Which landing pages with over 500 sessions have the worst bounce rates?
You can chart trends: Trend of new users this month? Graph of sessions from Chicago vs Seattle in December?
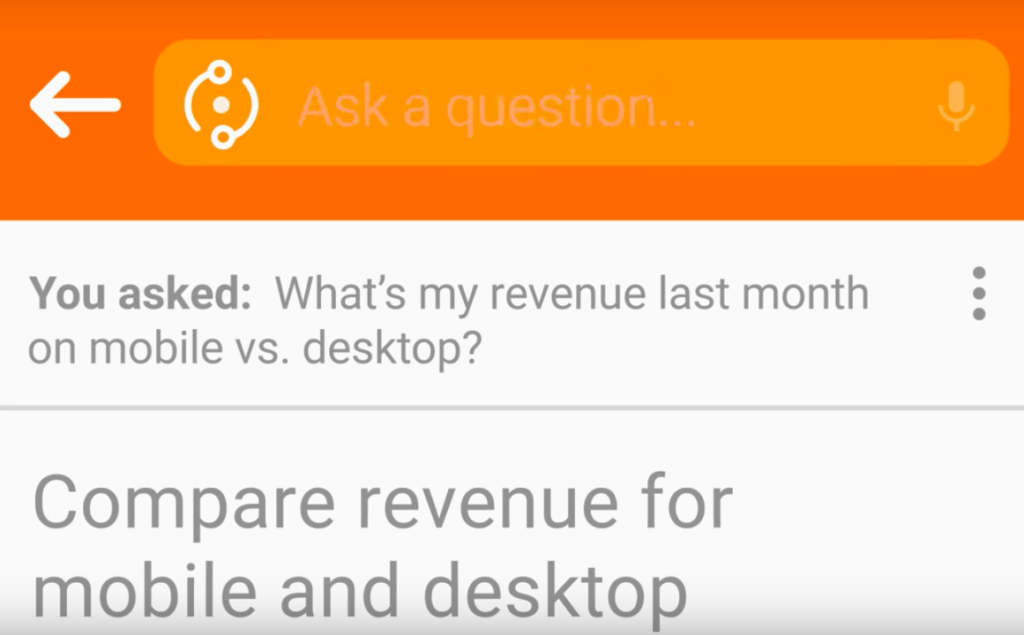
You can compare data for different values or time ranges: Conversion rate for referrals vs organic search? Average time on page for mobile vs desktop?
You can ask about shares or percentages to understand significance: What percent of sessions in the U.S. are from social? What share of sessions are from women?
You can ask complex questions combining multiple phrases: How did share of new users compare in January for Firefox vs Chrome? Trend of new users this year vs last year.
If you want to learn more about Google Analytics, be sure to attend PR News’ Measurement Boot Camp Nov. 9 in New York City, where Janneke van Geuns, Google’s head of analytics and insights, will be speaking at a keynote session called “How to Use Measurement to Win a Bigger Budget From Senior Leaders.”
Follow Jerry: @Jascierto