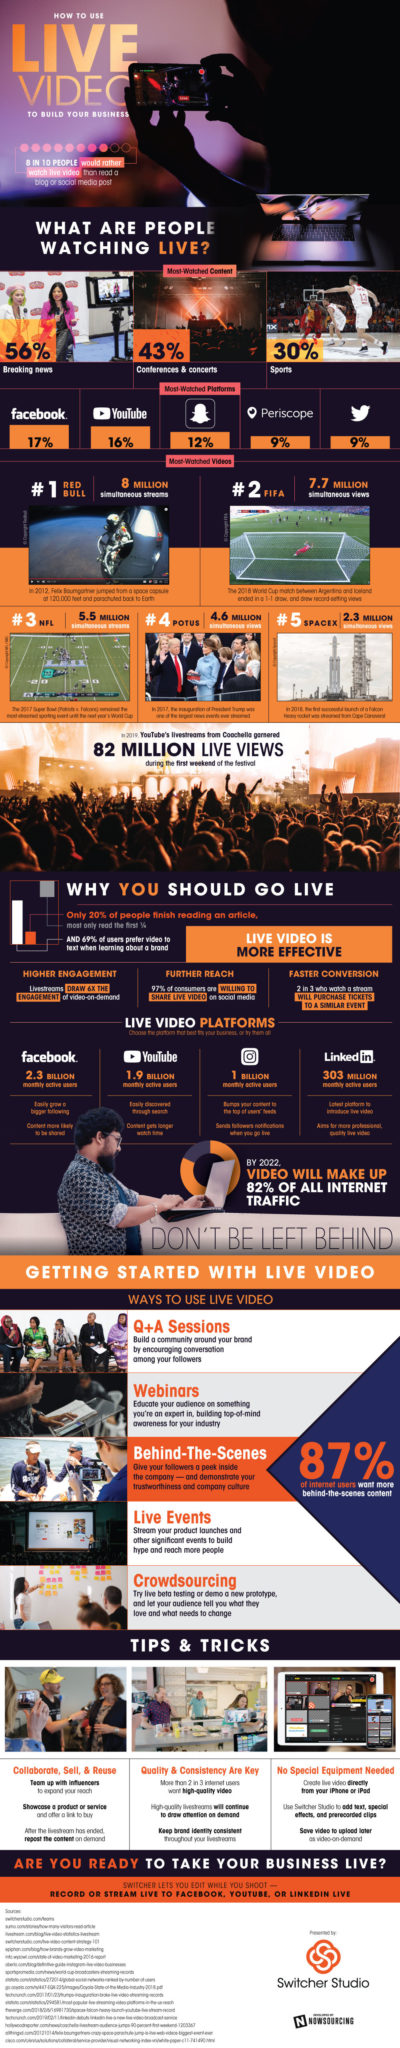
[INFOGRAPHIC] Live Video in 2019
By: Sophie Maerowitz
June 26, 2019
When Facebook Live launched in 2015, it was heralded as the future of social. Social media professionals rushed to the platform as Facebook made live video the exception from its de-prioritization of organic content. However, perhaps because brands and publishers didn’t see quite the return on investment they were hoping for, enthusiasm for live video in the marketing space started to fade in 2017, with Columbia Journalism Review reporting a 51 percent drop in brand output. Facebook began focusing its efforts on recruiting digital creators and brands for Watch, moving to a longform, pre-recorded video model.
Does this trend mean social marketers should stop investing in live video altogether? Absolutely not. If anything, with less brands clamoring for live viewers, smaller brands and nonprofits will have a renewed chance to stand out in the feed by going live on Instagram, Facebook and Twitter. Switcher Studio, a third-party service that offers overlays, visual effects, recording and screen sharing for live video, has compiled the following infographic with useful statistics and content ideas for live video.
If you’re looking to launch or re-launch a live video program at your brand, offer up some of the following stats and content ideas to senior leaders who believe the glory days of Facebook Live to be over. (Note: This image, like live video, is best viewed on mobile—or at Switcher Studio’s site, here.)