
How to Make the Most of Instagram Story Navigation Metrics
By: Sophie Maerowitz
June 6, 2019
Instagram business accounts produce one third of the highest engaged Stories on the platform. But how should businesses be benchmarking their Story efforts and taking action to further audience growth? Instagram’s native analytics (Insights) hold the key for social marketers who wish to iterate on recent successes.
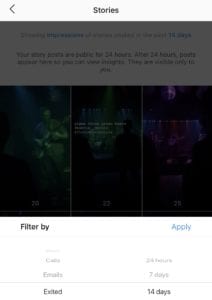
Business accounts can view Story metrics over the course of a day, a week or two weeks.
We’ll wager that no brand is publishing the maximum number of Story posts allowed per day (100). But how to tell whether your story should be split into three 15-second segments, or five? Navigation metrics are your friend.
Navigation stats can signal when your audience starts to tune you out, and when they are eager to consume more of your output. To view Navigation metrics inside the Instagram app, business accounts can go to Insights>Content>Stories>tap on the blue text (which defaults to “Impressions”) and then choose from the “Filter by” dropdown.
Here are some questions to ask and steps to consider based on noteworthy jumps in any Navigation metric:
Back: The number of taps back to see the previous Story.
- Ask yourself: If the number of taps back to the start seems abnormally high, was your content too jarring? Did viewers lack context?
- Action items: If the photo or video in question had people tapping back to re-watch, it might merit re-using or replicating the shot on a different day. Alternately, experiment with opening up with a “WTF” moment on purpose, including a tag or hashtag that users might want to revisit later.
Forward: The number of taps to see the next Story before the current Story is completed.
- Ask yourself: When did users tune out?
- Action item: If the average taps forward is high, you might be burying the lede. Try deleting unnecessary segments or reducing the number of segments in your next attempt.
Next Story: The number of swipes to the next account’s Story.
- Ask yourself: What did I post that was not connecting?
- Action items: If a large number of users are swiping through your Story altogether rather than taking the time to tap through and see if things get juicy, you’re likely not capturing their attention fast enough. Check to make sure that there aren’t repetitive segments, or segments that are difficult to parse (poor lighting, grainy resolution, crowded with text, overly salesy).
Exited: The number of times people closed your Story.
- Ask yourself: How are my unique exits comparing to my “Next Story” stats? If the numbers are close, it may be worth reducing the number of segments in your next attempt (to avoid users feeling spammed); if not, it’s possible your content jumped from “not connecting” to “annoying.” When was the last time you read or watched something on your desktop that made you want to close your browser altogether? A high number of exits and “Next Story” taps should have you endeavoring to avoid the same scenario for your Instagram followers.
- Action items: Try giving users a breather from your Stories content for a day or two (or reduce the number of segments you’re putting out). Experiment with new stickers, GIFS, polls and other interactive formats to shake up your content and get those who exited your Story previously back on board.
Follow Sophie: @SophieMaerowitz